At some point, you end up poking around a PCB with a scope and asking:
“What am I actually looking at?”
Two lines. Both switching. Both at similar voltages.
One of them is clock. The other is data.
They look similar at first glance — but they behave very differently once you know what to look for.
This is exactly the situation I hit probing a display driver IC. No labels, no documentation I could trust — just two lines and a scope.
The mistake everyone makes first
You probe both lines, see activity, and think:
“That must be SPI… or I²C… or something familiar”
Sometimes it is.
Often it isn’t.
The biggest mistake is trying to identify the protocol first.
Instead, start simpler:
👉 Which line is the clock?
Once you know that, everything else becomes easier.
What a clock signal actually looks like
A clock signal is boring — and that’s exactly what makes it useful.
You’re looking for:
- Consistent frequency (very regular timing)
- Clean square wave
- Continuous or bursty but uniform pulses
It typically looks like:
- evenly spaced transitions
- same high/low timing
- repeating pattern regardless of data
In short:
A clock doesn’t care what the data is doing — it just keeps ticking.
What a data signal looks like
Data is messy. That’s the whole point.
You’ll usually see:
- Irregular transitions
- Changes only at specific times
- Patterns that depend on what’s being sent
Key difference:
Data reacts to the clock — not the other way around.
The trick that makes it obvious
Once you probe both lines at the same time, look for this relationship:
👉 Does one line change state in sync with the edges of the other?
If yes:
- The stable, repeating one → clock
- The one that changes around those edges → data
This is the single most useful insight.
Timing tells you more than voltage ever will
One thing that doesn’t help much:
- “Both lines are 3.3V, so…?”
That tells you almost nothing.
Instead, focus on:
- edge alignment
- transition timing
- relative behaviour
For example:
- Data often changes on the rising or falling edge of the clock
- Between edges, data tends to stay stable
That’s how digital communication stays reliable.
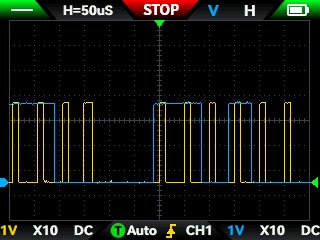
Real-world example (what I saw)
When probing the display driver:
- One line had a steady, repeating pulse train
- The other line looked chaotic in comparison
Overlaying them showed:
- the “chaotic” line only changed near clock edges
- the “steady” line just kept ticking
That was enough to confidently say:
👉 clock vs data identified — without knowing the protocol
Common traps to avoid
1. Assuming SPI immediately
Not everything with two lines is SPI.
Could be:
- proprietary serial
- bit-banged protocol
- something almost SPI but not quite
2. Trusting the datasheet blindly
Especially with cheap ICs:
- pin labels can be misleading
- “IO” doesn’t mean bidirectional in practice
Always verify with signals.
3. Looking at one signal in isolation
You need both lines visible at the same time.
Individually:
- both can look like valid signals
Together: - the relationship becomes obvious
4. Ignoring time scale
Zoom matters.
Too zoomed out:
- everything looks like noise
Too zoomed in:
- you miss the pattern
Find the level where repetition becomes visible.
Bonus: spotting other protocols (quick hints)
Once you’ve got clock vs data, you can start guessing more:
- SPI → separate clock + data lines, continuous clock during transfer
- I²C → clock + bidirectional data, with start/stop conditions
- UART → no clock line at all
But again — don’t start here.
Start with behaviour.
Why this matters
This isn’t just academic — it unlocks real things:
- tapping into unknown devices
- reverse engineering displays, sensors, modules
- validating whether signals match expectations
- debugging when things “should work” but don’t
Once you can confidently say “that’s the clock”, you’re no longer guessing — you’re analysing.
The takeaway
When you’re staring at unknown signals:
Don’t ask:
“What protocol is this?”
Ask:
“Which one is the clock?”
Because once you answer that,
everything else gets a lot easier.
No responses yet